


In September 2025, the Democratic Alliance (DA) named its federal council chair, Helen Zille, as its mayoral candidate for Johannesburg ahead of the 2026 local government elections.
Accepting her nomination, Zille said local government was about responsibility, not grand ideals. Its only job was to deliver basic services such as sewage, refuse removal, roads, traffic lights, electricity and water.
A few days later, Zille was interviewed on Johannesburg radio station 947. Unhappy with host Anele Mdoda's line of questioning, she praised a listener's query about her plans to fix Johannesburg’s water problem as “much more sensible”.
“The first thing people need is water. You can forget about all the other highfalutin stuff; they need water,” she said.
Johannesburg’s water crisis didn’t happen overnight, Zille said, but was the result of 30 years of zero maintenance. She compared this to the DA-run City of Cape Town, which she applauded for its water management record. But were her claims watertight? We checked.
Water and sewer pipes need regular replacement to prevent the infrastructure from wearing out.
Cities should aim to replace “about 1.5 to 2%” of their pipe networks every year, Ayesha Laher, water scientist and director of water management consultancy AHL Water, told Africa Check.
Johannesburg Water, the state-owned utility responsible for the city’s water infrastructure, said in its 2023/24 annual report that it needed to replace 175 to 185 kilometres (km) of pipe annually, about 1.5% of its network. Its actual performance has fallen far short.
In 2023/24, the utility replaced just 17 063 metres (17 km) of water pipe, slightly above its 16.6 km target. The city also replaced a little over 5 km of sewer pipes, far below the nearly 17 km planned.
In 2022/23, Johannesburg Water replaced 19 km of water pipes, against a target of 28 km, and just over 26 km of sewer pipes, against a 16 km target. In 2021/22, planned targets were far exceeded – 101 km of water pipes and 69 km of sewer pipes. In 2020/21, the totals were 105 km of water pipes and 16 km of sewer pipes.
Zille’s figure for 2023/2024 is correct, even if Johannesburg replaced far fewer pipes that year than in previous years.
Comparing Johannesburg’s pipe replacement figures with Cape Town, Zille claimed the city “does over 200 kilometres in a year”.
Cape Town’s Department of Water and Sanitation, which manages its water infrastructure, reported in 2023/24 that it had replaced “approximately 129 000 m of sewer and water pipes”. Most of this (97 000 metres or 97 km) was sewer pipe. This means around 32 km of water pipe was replaced, far below Zille’s “over 200 kilometres” figure.
The report doesn’t specify the total length of Cape Town’s pipe network or how much should be replaced annually, so it’s unclear if the 129 km meets the 1.5% benchmark.
The 2023/24 figures already show this claim is incorrect, but how did the city perform in earlier years?
In 2022/23, Cape Town replaced over 105 km of pipes, about 55 km of sewer and 50 km of water pipes.
In 2021/22, it replaced 51 km of water pipe and 29 km of sewer pipe. The same report notes that over the five years prior, the city replaced 230 km of water pipes and 236 km of sewer pipes in total.
This makes it impossible for the city to have replaced “over 200km” of water pipes – or even over 200 km of water and sewer pipes combined – per year since at least 2016/17.
Cape Town's reports provide less detail than Johannesburg Water's. They don’t always show the exact length of pipe replaced or the annual targets. The table below shows what is publicly available.
The data shows Zille’s claim about Cape Town’s historical performance is incorrect. The charts below compare Cape Town and Johannesburg.
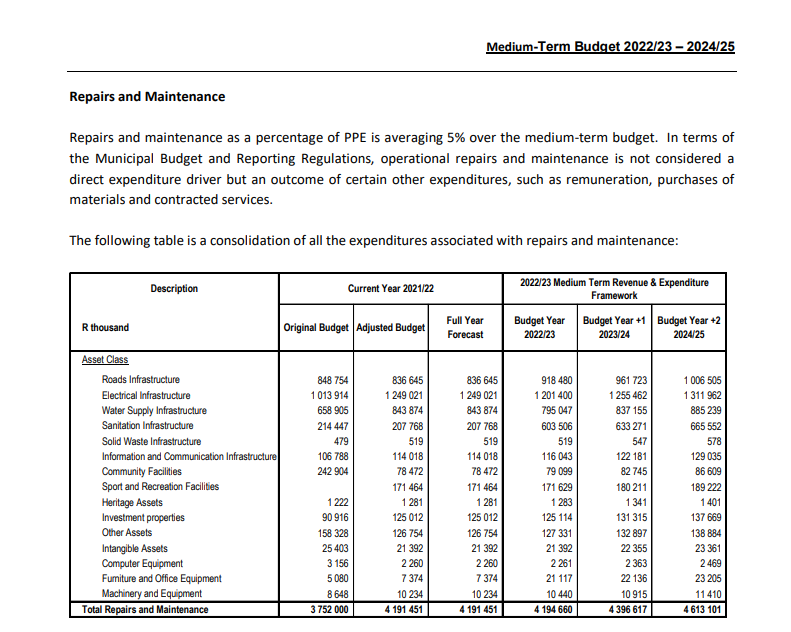
Zille argued that a lot of Johannesburg's operational budget should be redirected to maintenance, claiming that the city spends less on maintaining its water system than any other city in South Africa.
In 2024/25, the City of Johannesburg allocated R1.1-billion to maintaining its water supply infrastructure, a figure that was later adjusted to R901-million. It plans to spend R892-million in 2025/26 and R937-million in 2026/27.
These figures are consistent with past allocations – R1.1-billion in 2023/24, R826-million in 2022/23 and R844-million in 2021/22.
In comparison, the City of Cape Town spent R438-million in 2021/22, R505-million in 2022/23, and R497-million in 2023/24. Its adjusted budget for 2024/25 is R644-million, and it plans to spend R778-million and R854-million in 2025/26 and 2026/27, respectively.
Other metropolitan municipalities have allocated and spent less than the City of Johannesburg, as seen in the table below.
It is worth noting that some reported figures for Johannesburg, Tshwane and Nelson Mandela Bay were not audited. We have contacted the relevant departments for audited figures and will update this report accordingly.
Even so, if Johannesburg underspent on its repair and maintenance budgets, it is highly unlikely that it would have spent less than cities like Ekurhuleni, Mangaung and Buffalo City.
Disruptions in water supply linked to inadequate maintenance
Zille’s claim that Johannesburg spends less on maintenance than any other city in South Africa is incorrect, but that doesn’t mean there aren’t issues.
Civil society organisation WaterCAN says ageing infrastructure is a key driver of the city’s water supply failures. The Public Affairs Research Institute, affiliated with the University of Johannesburg and Wits University, also attributes declining water service delivery to “dilapidated and leaking Johannesburg Water infrastructure”.
Laher of AHL Water told Africa Check: “We know in the City of Johannesburg that the infrastructure has exceeded its useful lifespan, which is normally 40 years for normal reticulation networks of large cities, and we know the pipes are broken and they’re leaking and they need to be replaced. And you can see that by the manifestation of physical leaks.”
To assess this claim, we had to look at the city’s non-revenue water figures, Laher told Africa Check.
Non-revenue water is the difference between the volume of water in the system and the volume billed to customers. The concept was developed by the non-profit International Water Association.
“So, in any city all over the world, they set up a thing called a water balance … what it does is it gives any municipality anywhere in the world a way to categorise … all the water that it has … and come up with a calculation of non-revenue water,” Laher said. “Non-revenue means something that you get no value from … it’s not just physical leaks.”
Non-revenue water could, for example, include commercial losses from faulty metering or theft.
But to pinpoint the exact cause of the loss was difficult, Laher explained, which was why the umbrella term non-revenue water was used.
A November 2024 report by South Africa’s water department recorded a non-revenue water figure of 29.4% for the City of Cape Town. This is the latest publicly available figure Africa Check can find.
We also reached out to Cape Town’s water and sanitation department. Ken Sinclair-Smith, head of information, said current measurements for the city were “around 25%”.
While this is the lowest figure nationally, it is not one of the lowest in the world. In recent years, Tokyo (Japan) recorded 4%, Aarhus (Denmark) 5%, Lisbon (Portugal) 8% and Manila (the Philippines) 13%.
Prof Anja du Plessis is a water management expert and associate professor in the University of South Africa’s geography department. She told Africa Check that the international best-practice benchmark for non-revenue water was around 15%.
Johannesburg Water’s 2023/24 annual report recorded a non-revenue water figure of 46.2%. Pheladi Ramatshila, senior social media officer at Johannesburg Water, confirmed to Africa Check that this was the most recent verified and audited figure.
Du Plessis said that this did not mean nearly half of Johannesburg’s water was simply leaking away: “One has to break the given statistic down.”
Dr Ferrial Adam, executive director of WaterCAN, agreed. She told Africa Check that of the non-revenue water figure, “some of it is water that has not been billed or water that is stolen”.
The 46.2% reported in 2023/24 consisted of:
- 24.8% physical losses in the system, such as leaks
- 9.7% commercial losses, including meter tampering, theft or faulty readings
- 11.7% unbilled but authorised consumption, such as water supplied to informal settlements or for firefighting
Du Plessis said that Johannesburg’s non-revenue water levels remained above the international benchmark, the result of years of neglect, non-investment, poor planning and weak management.
According to Adam, “anything above 35% reflects poor performance”.
This report was written by Africa Check., a non-partisan fact-checking organisation. View the original piece on their website.